Page Weight
Introduction
Page weight is one of the simpler metrics available. Much like stepping on a human scale to get a sense of your personal weight (well, mass really, but you get it), loading a page will provide a sense of the number and size of resources collected and requested. But as the web and web pages have matured and grown, so have associated metrics — such as page weight. It can affect a page’s performance much like personal weight (mass) can do the same. This chapter will take a deeper dive and peel back the layers of web pages and see what it is that constitutes a page’s weight at the possible detriment of the end user: you, I, us.
#PageWeightStillMatters
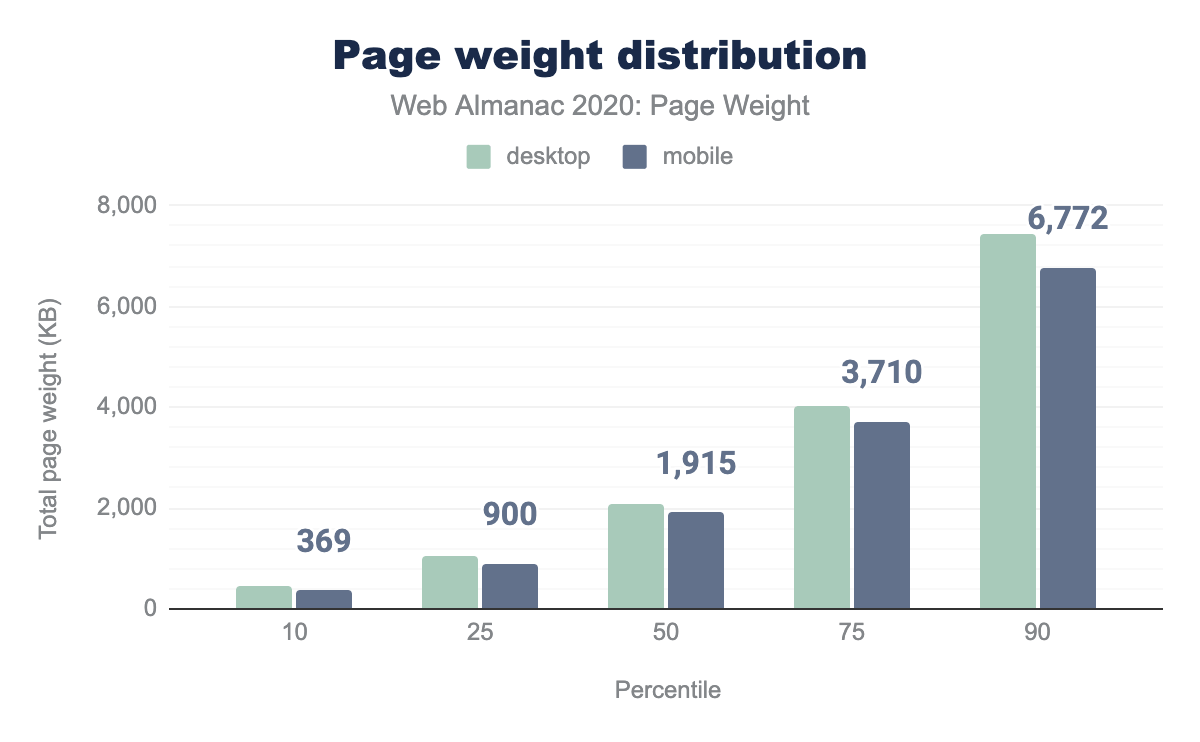
#PageWeightStillMatters would almost imply that it didn’t or ever mattered. It might not have mattered when text based Craigslist launched. But 25 years ago when it was founded, Mosaic 1.0 also launched the same year, and Waterfalls by TLC was a top hit. The web matured as did resources. It was just a few years back when the twitterverse was tied up discussing how the average size of web pages now equaled the size of the original doom. Many of us mused about what the size the page could become in time, including our very own Tammy Everts, but the reality is startling. A page sits @ ~4 MB and 3.7 MB, desktop/mobile respectively, at the 75th percentile, and a shocking 7.4 MB and 6.7 MB at the 90th percentile. There are multitudes of implications in having such heavy pages, like the likelihood of poor user experience due to unreliable networks. Today, despite lessons learned a decade ago, we are experiencing variations of the same challenges: despite having slightly better networks, we are working with much larger resources.
Bandwidth
In 2016, when asked to explain why an Australian tourist I’d talked to was delighted with UK internet, Google’s Ilya Grigorik had two words: physics damn it! (whoops, that’s three).
The point was simple: though you might benefit from increased bandwidth, the laws of physics still prevail. An Australian is unable to escape laws of latency. In the best case scenario, at home in Sydney, this Australian was experiencing enough latency that his internet was at times perceived as unresponsive.
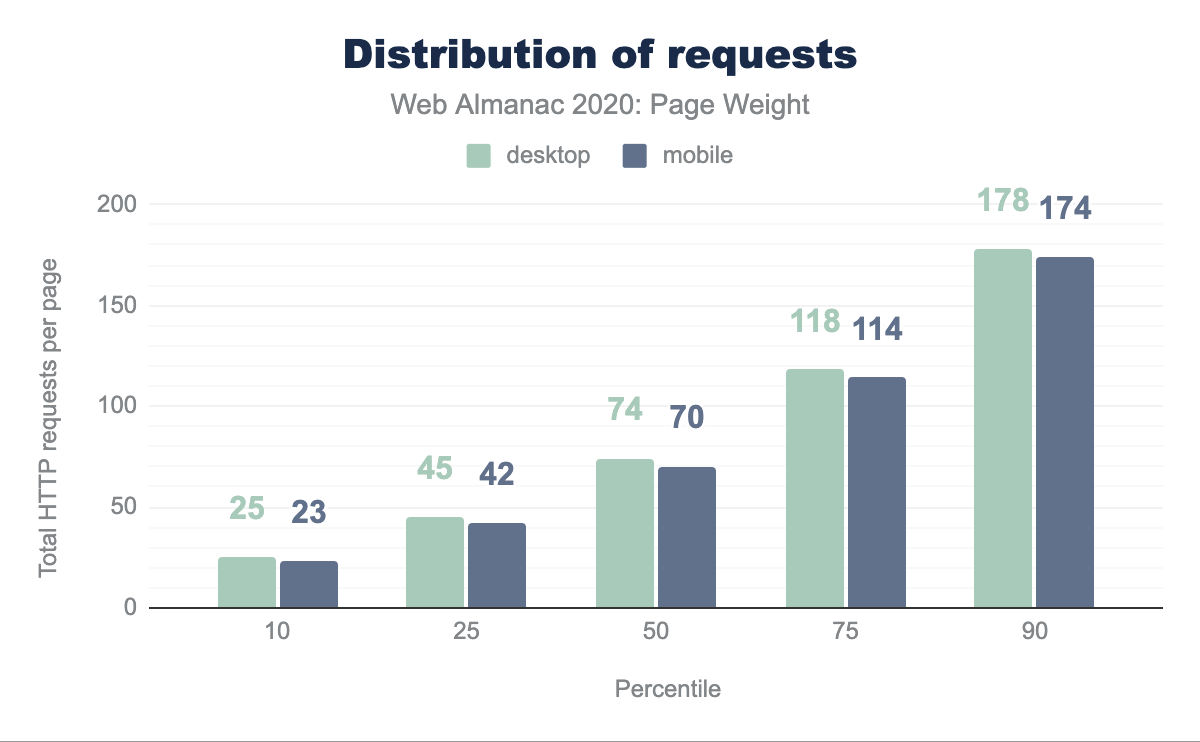
Now, imagine that the same Australian, knowing that at the 75th percentile, his page is making about 108 requests (more on that later), and we still have no idea of the network protocol, the resources being requested, the level of compression or optimization. You can pursue the HTTP/2 and Compression chapters for more information on the life of a modern request.
Assets
In 25 years of modern browsing, the assets and resources have mostly not changed, other than the amount. The HTTP archive modus operandi is “how the web was built”, and that was mostly done with HTML, CSS, JavaScript and finally images.
Prior to 1995, the web’s page weight was mostly predictable and manageable. But with RFC 1866, which introduced HTML 2.0 which introduced inline images via the <img> element, page weight would make a dramatic increase—all for the good of web development (adding images was seen as a positive experiment).
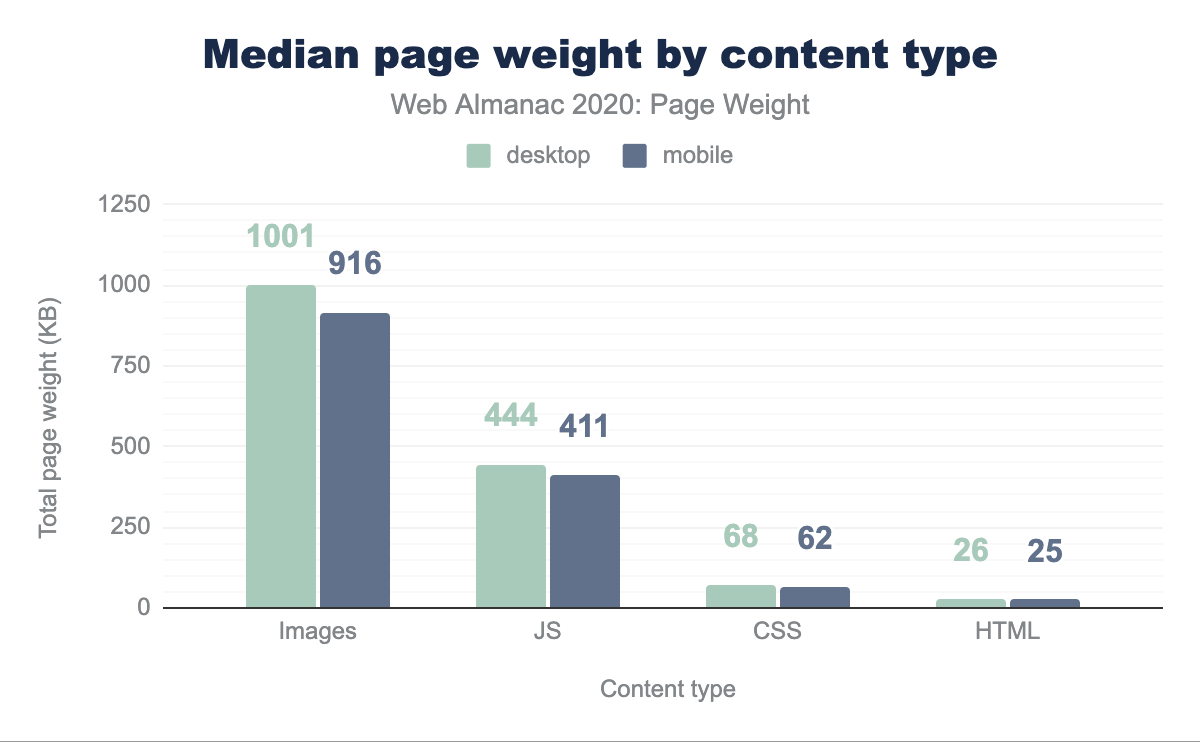
For the most part, the rule of thumb has been that images would make up the majority of page weight. It was certainly the case and a concern when in-line images were added to the web then and remains the case today. In a separate scenario, as image data will be the greatest source of page weight, it will also be the greatest source of page weight savings (again, more on that later). This will be achieved from ensuring that the images are sized properly, but also making sure that the images are at the optimization sweet spot - finding the best balance of quality and file size.
Although JavaScript is on average the second most abundant resource on a page, we tend to have more opportunities in working with that file type: from bundling, compression and minification to name a few.
Intricate and interactive
The web’s journey from the plain, near pedagogical platform, to the innovative, intricate and highly interactive apps that have become the norm, the rudimentary page weight metric hid a bigger story: a ratatouille of resources, each affecting modern metrics, in turn affecting user experience.
Whenever we talk about interactivity, we are talking almost exclusively about JavaScript. Now, though we are not here to discuss interactivity in any depth, we know there are metrics which are focused and dependent on JavaScript content and execution. So the weightier the JavaScript, the likelier it is to have a greater impact on interactivity metrics (time to interactive, total blocking time). We have the JavaScript chapter that dives a pinch more.
Analysis
As we post and parse the statistical results, the data is often based on transfer sizes. However, we are employing decompressed sizes in this analysis when possible.
Page weight
Let’s look at the classic page weight, on both desktop and mobile. The deltas are mostly due to a few less resources transferred on mobile, a likely pinch of media management, but you can see below that at the median, the differences are not that significant between the two clients.
We can however surmise from this the following: we are closing in on 7 MB of page weight on mobile and 7.5 MB on desktop at the 90th percentile. The data is following an age old trend: growth in page weight is on the upward trajectory yet again, from the previous year.
Popping the hood, we can see how things look at the median and average for each resource. One thing again remains: images are the dominant resource and JavaScript is the second most abundant, though a far second.
Requests
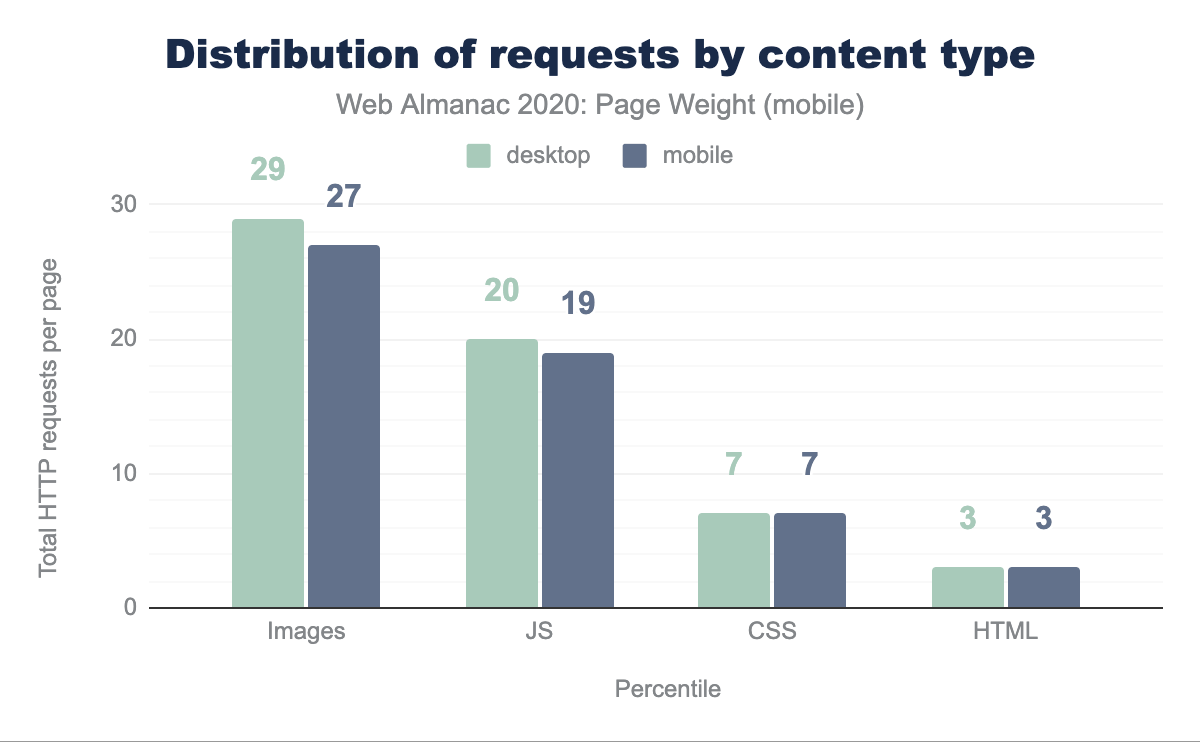
We have an old adage: the quickest request is the one never made. Dare we then say: the smallest resource is one never requested. At the request level, much is the same. The weightiest resources are making the most requests.
The request distribution shows that the difference between desktop and mobile is not so significant, with desktop leading the way. Something worth noting: the median request on desktop at this time is the same as last year (74), yet the page weight has ticked up (+122kb). A simple observation, but one which confirms the trajectory we’ve seen over the years.
Images again make up the largest number of requests, though JavaScript is closing in as the gap has narrowed slightly in the last year.
File formats
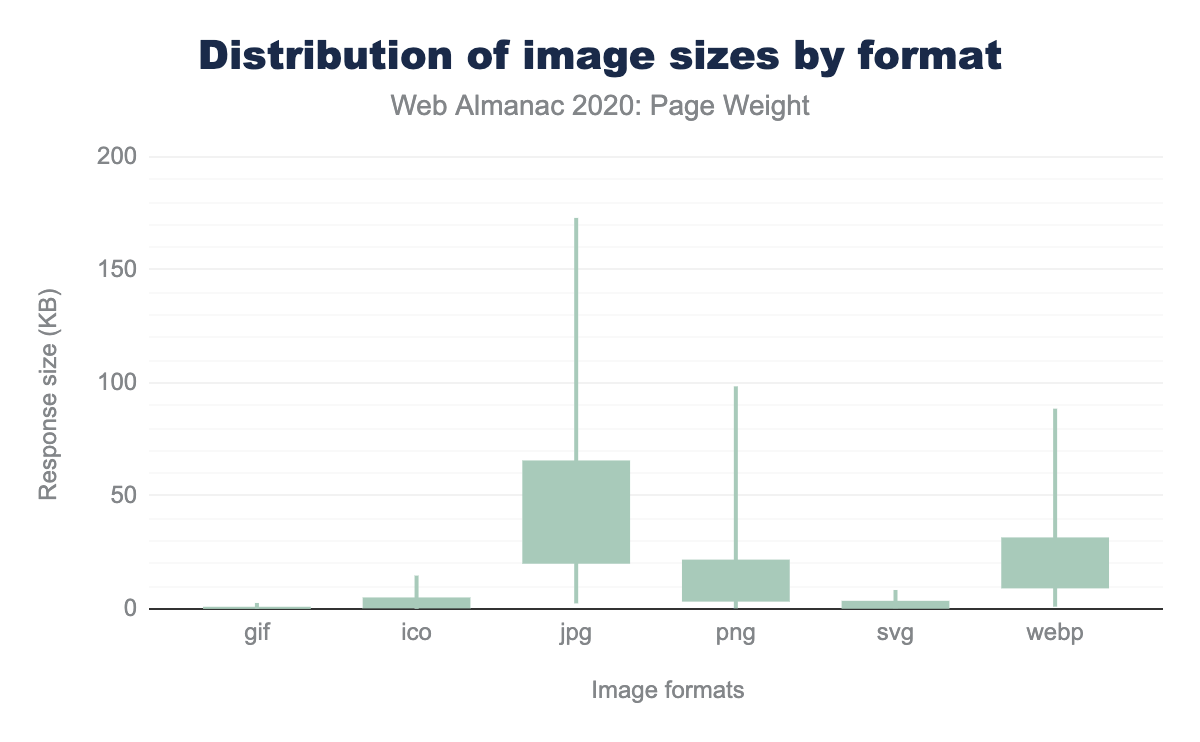
We know that images are a great source of page weight. This graphic above shows us the top sources of image weight and the weight distribution. Top 3: JPG, PNG and WebP. So not only is the JPG the most popular image format, it also tends to be the largest by size as well - even larger than a lossless format like the PNG. But as we noted last year, that has to do with the predominant use case for the PNG, which seems to be icons and logos.
Image bytes
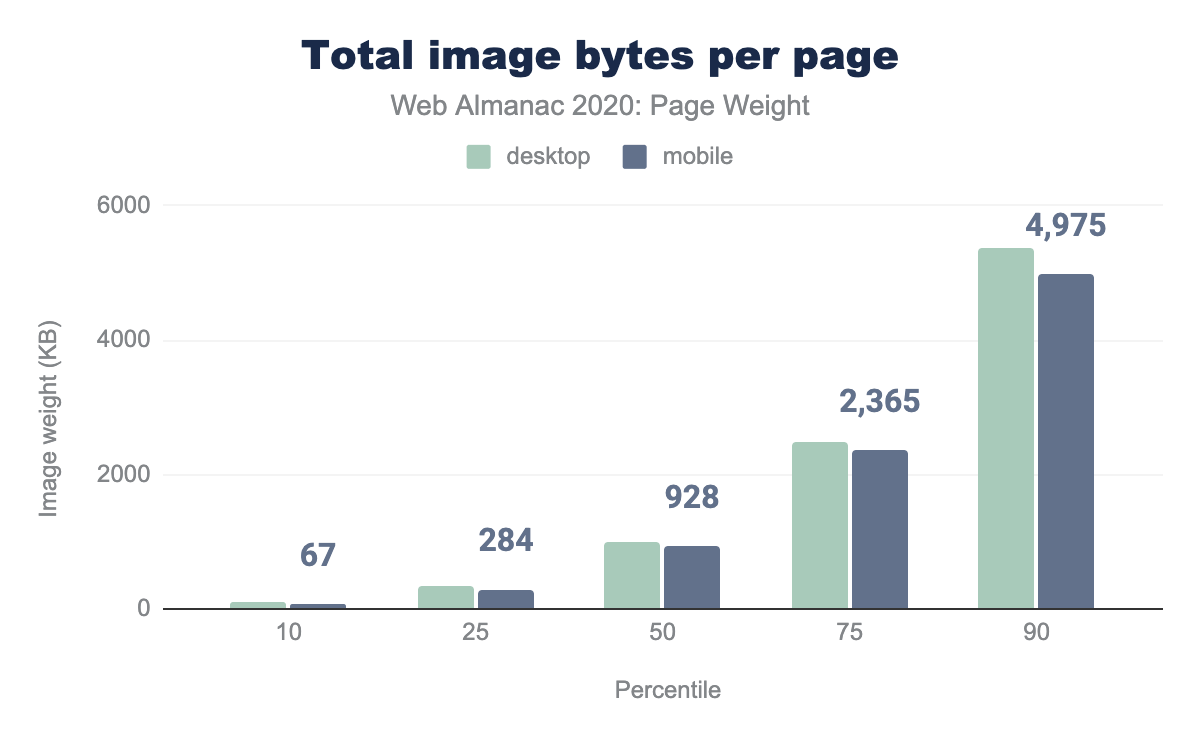
Looking at total image bytes, we see the same trend upwards, as noted previously on overall page weight.
COVID-19
2020 has been the most demanding of any year in internet history. This is based on self-reporting by telecom companies all over the globe. YouTube, Netflix, gaming console manufacturers and many more were asked to throttle their networks due to anticipated bandwidth demands of COVID-19 and the stay at home orders. There are now new suspects creating demands on the networks: we are now working from home, teleconferencing from home, and schooling from home as well. In the midst of this crisis some government organizations have moved forward to optimize all aspects of the site and redesign or update. Two such examples of being ca.gov (link) and gov.uk. In these times, COVID-19 has certified the internet as an essential service and being able to access crucial and life-saving information, must be as friction free as possible, which includes a manageable page weight via discipline delivery of data.
If we have been married to the internet, COVID-19 has forced us to renew our vows. Assuring that content is delivered as efficiently as possible over the internet, page weight must be kept at the forefront at all times.
A not so distant future
We have watched for 25 years page weight grow steadily. It might have been one of the greatest stock investments — had it been one. But this is the web and, we are trying to manage data, requests, file size and ultimately page weight.
We have just combed over data, seeing how images are the greatest source of weight. This means, it will also be our greatest source of savings. 2020 was a pivotal year, a possible inflection point for HTTP Archive tracking of web data. 2020 marked the year the modern format WebP was finally adopted by Safari, making this format finally supported by all browsers across the board. This means that the format could comfortably be used with little to no fall back. The most important point? The potential for significant page weight savings is there — at a possible 30%.
Even more interesting is the idea of a more modern format: avif. This format has burst onto the scene with enough support today for approximately 70% browser market share, creating a scenario for small image file sizes - even smaller than WebP. And lastly, and possibly most distant: media queries level 5, prefers-reduced-data. Though in very early draft, this media feature will be used to detect if a user may have a preference for variant resources in data sensitive situations and has already started to become available in browsers.
Looking at the crystal ball, the third installment of the Web Almanac and the Page Weight chapter could have a much different look in 2021. The big technological and engineering investments into images, might finally provide the diminishing returns we have been looking for.
Conclusion
It’s of no surprise that web pages have generally kept growing. We have been feeding more resources down the wire to create richer experiences, more engaging interactivity, more stunning visuals through more powerful imagery. We have created these applications at the cost of data overages and user experiences. But as we move forward and keep pushing the web to places we had never anticipated, we are also making additional advances in engineering, as mentioned earlier. We may begin to see a drop in page weight as early as next year, as modern raster image formats see more adoption, we start to manage JavaScript more efficiently, and deliver the data down the wire with the discipline that users demand.
